[ Home :
3B Microscopy
|
Localisation Reclassification
|
Publications
|
Teaching
|
Research
]
Charge Ordering in the Manganites

Charge density waves in the manganites
Certain manganite compounds such as La1-xCaxMnO3 exhibit superstructures which can be observed using TEM (transmission electron microscopy).
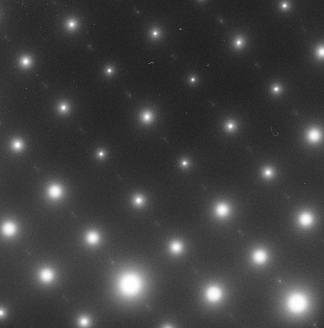
The superlattice is an unusual example of a charge density wave in a material with a high resistivity.
Indications of Weak Coupling from Simulations
Simulations of diffraction patterns for charge ordered system with very strong
electron-phonon coupling give rise to peak shapes which are not observed. The
simulated lattice reflections were either much too broad or contain extra
reflections which are not observed.
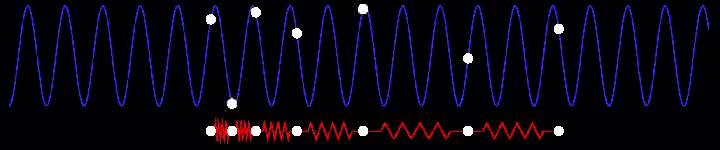
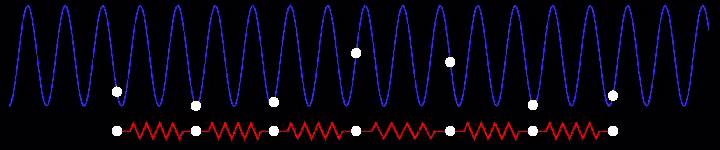
The Frenkel-Kontorova model was then used to model various levels of coupling by
modelling electron-electron interaction as springs and electron-lattice
interaction as interaction with a sinusoidal potential:
 |
Start |
 |
End |
Video of the model relaxing into a low temperature state.
The random starting state and frustrated end state causes variance in the
wavenumber calculated from the simulation, and the variance increases as the
coupling increases. Variance in the measured wave vector of real samples is
caused by a number of factors, so the simulation puts an upper limit on the
coupling in real systems. This upper limit indicates that the electron-phonon
coupling is very weak.
Confirming the weak coupling by controlling the strain
The periodicity changes when strain in a sample is changed. This strongly indicates that
the periodicity is not strongly coupled to the lattice because changing the strain changes the
periodicity of the superlattice much more than the periodicity of the parent lattice.
This was tested by growing a thin film of manganite on an NGO substrate,
creating a strained film due to the lattice mismatch. Then, some of the NGO was
milled away to relieve the strain in a certain region.
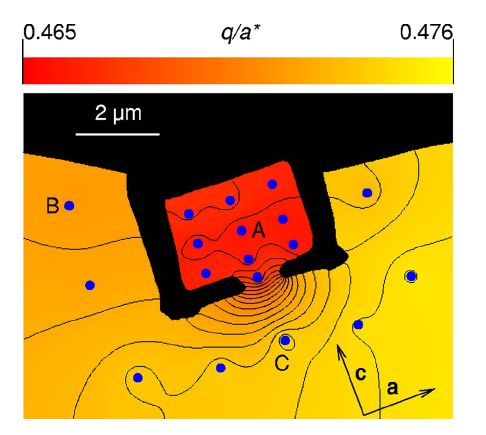
The superlattice periodicity was then found at 18 locations, by accurately measuring the
positions of most of the superlattice reflections in the TEM images, using some specially developed
computer vision techniques.
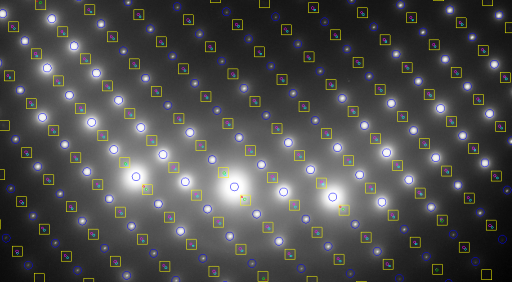
All the superlattice measurements are shown in a false colour map overlaid on a
TEM picture of the sample. Note that the black regions have been cut away to
relieve the strain in the central region.
Heat capacity consistent with CDW
Presence of CDW demonstrated by electrical measurements
History dependent resistivity
Hysteretic resistivity features are typical
of CDWs in pinned and sliding states. As the sample is
cooled, the CDW settles into a minimum-free-energy pinned
configuration, corresponding to maximum electrical resistivity.
On the application of a strong electric field,
and the CDW starts to slide. As the field is reduced again, the
CDW freezes into a distorted state, characterized by a lower
resistivity; the initial, minimum energy state cannot be regained
without thermally cycling the sample, explaining the hysteresis in
our data.
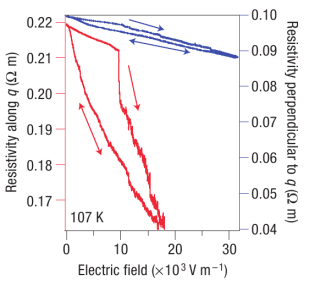
The hysteresis loop only occurs on the first cycling of the field.
On subsequent cyclings without thermally resetting the sample, only the lower curve is followed.
Broadband noise
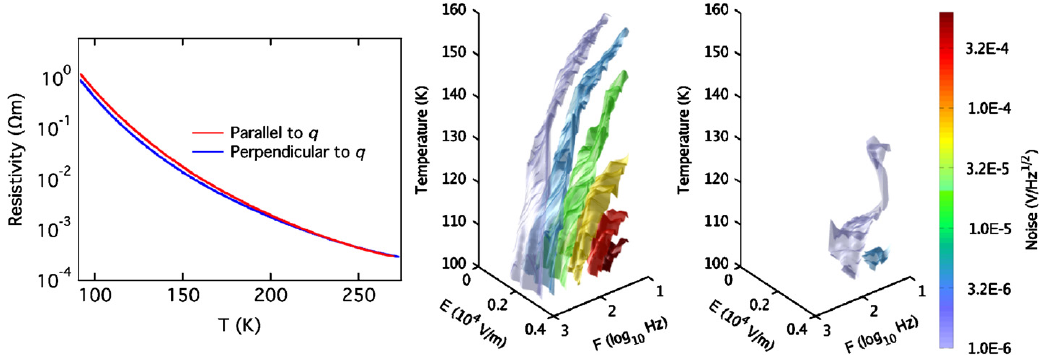
Despite the small difference in resistivity (left), huge amounts of broadband 1/f noise are exhibited
along the superlattice direction (centre), compared to across the superlattice (right). Note that the
coloured surfaces represent noise equipotentials. The noise is very high with an
effective temperature of 1011 K), and is strongly aligned with
the direction of the superlattice. These characteristics are typical of a CDW
system.
Additionally, the onset of noise is
correlated with a sharp drop in resistivity:
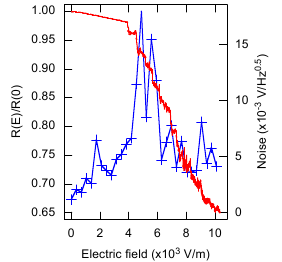
Red: Resistivity. Blue: Noise.
This shows that the most likely cause of the noise is due to the CDW sliding.
Random telegraph noise
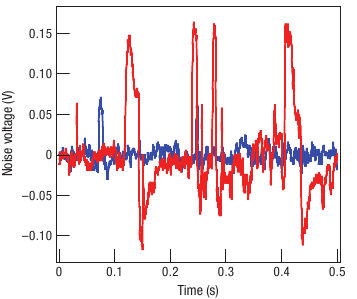
Red: parallel to q Blue: perpendicular to q
The sample also exhibits strong random telegraph noise in the direction of the
superlattice. This is characteristic of a CDW.
Updated February 18th 2011, 08:06